You may change various HR processes, such as hiring, turnover, training, talent management, and performance management, by utilizing HR Analytics tools.
These resources are essential for developing a data-driven HR model for your business.
The everyday process of interacting with data gathered throughout the company is one part of managing human resources.
However, the organization’s ability to obtain valuable insights from these workforce data sets is frequently constrained by a need for appropriate procedures and processes, reducing productivity over time.
HR analytics help allow quick data collection and analysis of employee-related variables to enhance overall business results.
What is HR analytics?
HR analytics uses data and statistical analysis to understand and inform decisions about managing an organization’s human resources.
Uncovering trends and patterns that guide choices regarding talent management, training, and other HR efforts can involve examining data on employee attrition, recruiting, performance, and other topics.
HR analytics uses data to increase the efficacy of HR programmes and initiatives to support overall corporate goals and objectives..
Are HR Analytics tools helpful?
With HR analytics technologies, business choices concerning the personnel required to create a competitive advantage may be supported by insights that can be implemented.
HR Analytics tools give predictive analytics to direct hiring choices by capturing insights from unstructured data, such as employee goals and experiences.
Here is a list of 10 HR analytics tools that let HR professionals use modelling, statistics, and other analysis approaches to gain a quantified understanding of important organizational metrics, including time to hire, recruiting costs, attrition, engagement levels, and absenteeism.
1. ChatHop
ChartHop is a workforce management and analytics platform that helps organizations understand and optimize their workforce.
Platform users may access, examine, and manage employee data in one spot.
It has tools like org charts, data visualization, and reporting capabilities that may be used to spot patterns and trends in information about employees, such as turnover, hiring, and performance.
ChartHop also interacts with other HR systems, including HRIS and application tracking platforms, to comprehensively picture personnel data.
The workforce planning and budgeting capabilities included in ChartHop may also be used to estimate labour requirements, pinpoint skill shortages, and make data-driven choices on headcount and budget allocation.
Additionally, the platform simplifies handling personnel data such as headcount, budget, roles, and reports.
With ChartHop, businesses can more effectively manage their personnel and integrate worker initiatives with overarching corporate goals and objectives.
2. IBM ILOG CPLEX Optimizer
IBM ILOG CPLEX Optimizer is used to address complex optimization issues. It is a potent mathematical optimization programme made to assist businesses in making better decisions by locating the most effective answers to challenging issues.
The software uses sophisticated algorithms to tackle issues with linear and nonlinear programming, mixed-integer programming, and global optimization. It may be applied to logistics, supply chain management, scheduling, and resource allocation issues.
In operations research and management science, the IBM ILOG CPLEX Optimizer is primarily used to simulate and address issues with resource allocation, scheduling, and logistics. It may be used in many sectors, including manufacturing, transportation, banking, and healthcare.
IBM ILOG CPLEX Optimizer may be used with additional software applications like Gurobi Optimizer, MATLAB, and R to assist businesses in creating optimization models and deriving insights from the outcomes. It is compatible with various computer languages, including C++, Java, Python, and .NET, and it may be used to tackle complicated optimization issues in a distributed setting.
3. Microsoft Excel
Spreadsheet software like Microsoft Excel is quite popular for managing and analyzing data. It enables users to make, modify, and format spreadsheets and run computations and data analysis on big data sets.
Excel is a flexible application that may be used for various activities, such as budgeting, forecasting, financial analysis, data visualization and reporting. It has several capabilities that may be used to analyze and show data in a meaningful fashion, including formulae, pivot tables, and charts.
Due to its ability to do complicated computations, build financial models, and analyze financial data, Excel is widely used in business and finance. Additionally, it is utilized in HR analytics to examine information on hiring, performance, and employee turnover. Various statistical functions already included in Excel can be utilized for data analysis and modelling.
Excel may also generate dashboards and reports, which can be shared with others to share data and insights. It can be used with other software tools like Power BI, Tableau, and R to produce more complex data visualisations and insights.
Microsoft Excel is a frequently used programme renowned for its adaptability and versatility in data management and analysis.
4. Microsoft Power BI
Microsoft Power BI is a business intelligence and data visualization tool that allows users to connect, analyze, and share data from various sources. It helps organizations turn raw data into interactive and visually appealing reports and dashboards. Power BI provides a powerful set of data visualization tools that may be used to create interactive charts, maps, and reports.
With Power BI, users can connect to numerous data sources, including Excel spreadsheets, databases, and cloud services such as Azure, and then use the tool’s drag-and-drop interface to transform and analyze the data. Power BI also supports data modelling, meaning users can create relationships between tables and calculate columns and measures.
Power BI also includes features like data exploration, data visualization and reporting, which can be used to make interactive dashboards and reports that can be shared with others. Users can also create alerts and notifications when data meets certain conditions and schedule automatic data refresh to keep data up-to-date.
In addition, Power BI can be integrated with other Microsoft products, such as Excel and SharePoint, and other tools like R and Python. Power BI also allows sharing the dashboards and reports with others, either by sharing the link or embedding the report to a website or application.
Microsoft Power BI is a powerful tool that allows organizations to turn data into actionable insights and make better decisions.
5. Qlik
Qlik is a business intelligence and data visualization tool that allows users to create interactive visualizations and reports.
It provides a unique data discovery and exploration platform that allows users to easily connect and analyze data from various sources.
One of the main features of Qlik is its “associative data model”, which allows users to explore data naturally.
This model allows users to analyze data by making selections and filtering and to see the relationships between different data points in real-time.
This allows for easy data exploration and discovery and makes it easy to find insights that might not be immediately obvious from the raw data.
Qlik also includes features like data visualization, reporting, and dashboarding that can be used to create interactive charts, maps, and reports.
Users can also create alerts and notifications when data meets certain conditions and schedule automatic data refreshes to keep data up-to-date.
In addition, Qlik can be integrated with other tools, such as R and Python. It also offers a developer API that allows organizations to build custom applications on top of the platform.
Qlik also has a cloud-based and on-premise version, allowing users to choose the solution that best suits their needs.
Overall, Qlik is a powerful tool that allows organizations to easily explore, analyze and share their data, and make better data-driven decisions.
6. R
R is a software environment and programming language for statistical computation and graphics. For data analysis, visualization, and modelling, statisticians, data scientists, and researchers frequently utilize it. A sizable and vibrant community has grown around R, producing various libraries and packages for data analysis and visualization.
R provides a wide variety of built-in statistical and graphical functions for data exploration, visualisation, and modelling. Additionally, various packages, including those for machine learning, natural language processing, and geographical analysis, may be utilized for various specialized applications.
R is a robust programme many researchers, statisticians, and data scientists use for data analysis, visualization, and modelling.
7. IBM SPSS
IBM SPSS (Statistical Package for the Social Sciences) is used for statistical analysis in the business, health, and social sciences. Data preparation, analysis, and visualization are just a few things it may be used for.
Descriptive statistics, t-tests, ANOVA, and regression analysis are only a few statistical techniques included in SPSS. Advanced approaches are also included, including component analysis, cluster analysis, and survival analysis.
One of SPSS’s key advantages is its intuitive user interface, making it simple for users to conduct intricate statistical analysis. Various data visualization tools, including graphs and charts, are also included. These tools may be used to produce visual representations of data.
8. Tableau
Tableau is a data visualization and business intelligence software that allows users to create interactive and visually appealing dashboards and reports. Organizations may use it to better understand their data, analyze it, and share insights with others. Tableau is renowned for its user-friendliness, clear drag-and-drop interface, and versatility in terms of connecting to different types of data sources.
Using a range of graphs, maps, and charts, Tableau users may produce interactive visualizations and dashboards. Additionally, it has various sophisticated analytics tools that may be utilized to carry out more intricate data analysis, including statistical modelling, forecasting, and clustering.
Tableau’s capacity to manage massive volumes of data and swiftly present it in relevant ways by employing various visuals is one of its primary advantages. Additionally, it has various tools for collaboration, including the capacity to let users interact with the data and create their discoveries, as well as the option to share dashboards and reports with others.
Tableau may be used with software programs like Excel and R and with programming languages like Python to produce more complex data analysis and visualization.
If you want to learn about using Tableau effectively, join the CHRMP Tableau course.
9. Visier
Organizations may use Visier, a cloud-based workforce analytics and planning platform, to help them make informed choices about their personnel. It makes data on personnel headcount, budget, roles, and reports accessible for users to exchange, evaluate, and do so conveniently. The platform uses cutting-edge analytics and visualization capabilities to offer insights on performance, skills shortages, and workforce trends.
One of its key characteristics is Visier’s capacity to link to and combine data from many sources, including HRIS, payroll, and talent management systems, to offer a thorough perspective of the workforce. Along with the flexibility to build bespoke analytics to address certain business concerns, it also contains several pre-built analytics, such as headcount and staff budget planning.
Visier also comes with various sharing and collaboration tools, such as letting users engage with the data and create their own discoveries while sharing dashboards and reports. It also has a range of workforce planning and budgeting tools, which can be used to estimate labour requirements, pinpoint skill shortages, and make data-driven choices about hiring and spending.
Visier, an effective and frequently used solution for workforce analytics and planning, offers insights into workforce trends, skills gaps, and performance, enabling companies to make data-driven choices regarding their personnel.
10. Python
Python is a high-level, all-purpose programming language for artificial intelligence, machine learning, and data analysis. Python is a popular language for developers of all skill levels because of its simplicity, readability, and versatility.
NumPy, pandas, and Matplotlib are just a few examples of the many libraries and frameworks for data analysis and visualization created by the Python community, which is vast and active. Additionally, it contains a variety of machine learning libraries, including TensorFlow, Keras, and sci-kit-learn.
Various libraries in Python are also helpful in cleaning and manipulating massive amounts of data, such as pandas, which makes it simple to do so. Additionally, several tools for data visualization, such as Matplotlib and Seaborn, are available, enabling users to produce high-quality data visualizations.
To produce more sophisticated data analysis and visualization, Python may be used with other computer languages like R and software applications like Excel and Power BI. Additionally, Python includes a variety of packages that are useful for web scraping, data scraping, and NLP.
Python’s simplicity, readability, and versatility make it a solid and popular tool for data analysis, machine learning, artificial intelligence, and several other uses.
What is the need for HR analytics software?
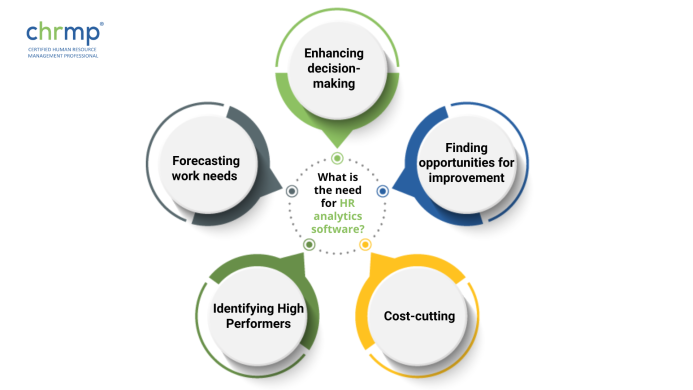
1.Enhancing decision-making: Improving the quality of decisions about managing an organization’s human resources is one of the critical goals of employing HR analytics software. Organizations can find trends and patterns that help guide choices about talent management, training, and other HR efforts by evaluating data on employee attrition, recruiting, performance, and other HR indicators.
2. Finding opportunities for improvement: Employee happiness, engagement, and retention are just a few measures that can be tracked with HR analytics software. By examining data on these measures, organizations can determine areas where they may need to make changes or enhancements to increase employee happiness and engagement and lower turnover.
3. Cost-cutting: Companies may find potential cost-saving opportunities by employing HR analytics software to evaluate data on hiring, training, and other HR efforts. Organizations may, for instance, determine why workers are departing and take action to decrease turnover and the related expenses of recruiting and training by evaluating data on employee turnover.
4. Identifying High Performers: Employers may locate high performers and build programmes to assist them in rising within the company by examining data on employee performance. Additionally, by doing this, businesses can keep their best employees, which is crucial for the company’s long-term survival.
5. Forecasting work needs:
- Making data-driven choices on headcount and budget allocation.
- Forecasting workforce demands.
- Identifying skills shortages are all possible with HR analytics software.
This will assist businesses in making plans for their future workforce requirements and ensuring their personnel have the necessary skills to accomplish their objectives.
Benefits of HR Analytics for Your Business
Management at an organization may use HR analytics to process data they were previously ignorant of, put new policies into place, and generally make better business decisions.
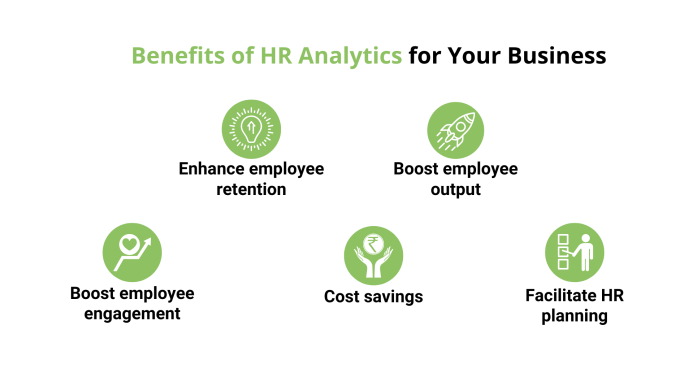
1.Enhance employee retention: Analyzing specific metrics and better understanding employee sentiment through staff satisfaction surveys may provide a wealth of information about why employees leave a firm on their own. This will enable us to attempt to decrease the leaving rate by implementing specific preventative measures. By keeping 40% of its “flight risk” workers, Nielsen raised staff retention rates by 48%.
2. Boost employee output: With data, team leaders and the HR division can determine what drives employees and prevents them from achieving their potential. One must go beyond the performance assessment to identify patterns and create an improvement strategy.
A thorough data analysis can show if the firm’s advantages translate into greater performance or higher retention, which may help build stronger pay and incentive programmes. They can even inform us, for instance, whether salary rises have a minimal impact on some populations (which can save the organization a lot of money).
3. Boost employee engagement: Using data, we can learn how people feel and modify workspaces to make employees feel good.
4. Facilitate HR planning: Predictive HR analytics enables us to develop comparatively accurate personnel fluctuation estimates. We will be better prepared to step in if we can predict when key jobs will leave. Similarly, it will be much simpler to spot personnel surpluses or shortages in a particular region.
5. Cost savings: Having access to accurate, unbiased information enables us to take more informed decisions and actions, which influences business budgets.
Important features of HR analytics tools
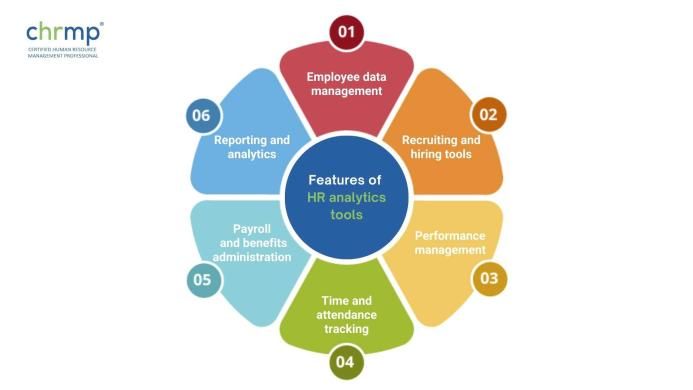
1.Employee data management: The ability to store, organize, and track employee information, including personal details, job history, and performance metrics.
2. Recruiting and hiring tools: Features that aid in the recruitment and hiring process, such as job posting, candidate tracking, and onboarding.
3. Performance management: Tools for tracking and evaluating employee performance, including goal setting, performance reviews, and feedback.
4. Time and attendance tracking: The ability to track employee time and attendance, including overtime, sick leave, and vacation time.
5. Payroll and benefits administration: Features that assist with payroll processing and benefits administration, such as calculating taxes and deductions and providing employee access to benefits information.
6. Reporting and analytics: The ability to generate reports and analyze data on various HR metrics, such as turnover rate, employee engagement, and workforce demographics.
How to Choose the Best HR Analytics Tools?
It might be difficult to choose the finest HR analytics tools for your company, but there are a few important factors to take into account:
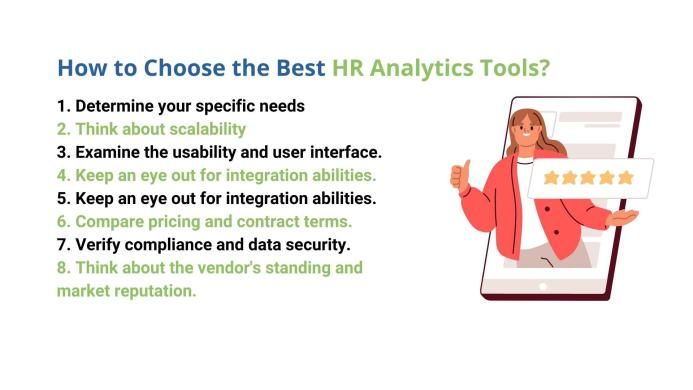
1.Determine your specific needs: Choose the HR procedures and data to monitor and analyze, then hunt for HR Analytics Tools that meet those requirements.
2. Think about scalability: Your organization’s demands for HR Analytics Tools may evolve as it expands. Find a solution that will grow with your business.
3. Examine the usability and user interface: Since HR analytics tools might be complicated, selecting a system with an intuitive design and simple functions is crucial.
4. Keep an eye out for integration abilities: Make sure the software is compatible with any other programmes you may currently use, such as payroll, time and attendance, or applicant tracking systems.
5. Keep an eye out for integration abilities: Make sure the vendor offers thorough support and customer service, as well as training and tools to help you make the most of the programme.
6. Compare pricing and contract terms: To locate a solution that matches your budget and satisfies your demands, compare price choices and contract terms.
7. Verify compliance and data security: Verify that the vendor has robust data security mechanisms to protect sensitive employee information and that the software complies with all applicable laws and regulations.
8. Think about the vendor’s standing and market reputation:
- Examine the seller’s reputation in the industry.
- Speak with other businesses using the programme.
- Look up reviews and ratings online.
An overview of the most popular HR analytics tools is given in this article. Check out our HR analytics certification to learn more about using Excel and Tableau to analyze data and create HR dashboards.
Frequently asked questions (faqs)
1. What are HR analytics and people analytics?
The application of data and analytics to support and enhance human resource management decisions is called HR analytics, often called people analytics. It entails gathering, examining, and evaluating the information on the workforce, including information about hiring, performance, turnover, and engagement. HR analytics aims to find patterns, trends, and insights that can assist businesses in making better decisions about their workforce, boost engagement and productivity among employees and eventually lead to better commercial outcomes.
People analytics utilises data and analytics to understand the workforce and make choices that enhance organizational performance. It is a subset of HR analytics primarily utilized to manage the workforce in the contemporary digital world. It is a method for analyzing data about people and their behaviour at work to help with performance management, recruiting, and other HR-related choices.
In conclusion, people and HR analytics use data to support and enhance HR management choices. However, in the current digital era, people analytics is a more precise phrase, whereas HR analytics is a more general term.
2. What are the benefits of HR analytics?
Better decision-making: HR workers may make better choices using HR analytics, which can offer insightful information on HR performance.
Efficiency gain: Analytics may be used to automate and improve HR processes.
Cost savings: HR analytics may assist firms in cutting expenses by analyzing data to pinpoint areas that need improvement.
HR analytics may assist in increasing employee engagement and retention by using data to pinpoint areas that need improvement in processes like recruiting and retention.
Better adherence to legislation: Analytics may assist HR professionals in ensuring adherence to laws and regulations.
3. How to get an HR analytics online course
There are several options for getting an HR analytics online course. One way is to look for reputable universities or educational institutions that offer HR analytics as part of their curriculum.
You can consider taking the HR analytics certification course for a specific certification. This course is offered by CHRMP (Certified Human Resource Management Professional). It is designed to provide HR professionals with the knowledge and skills to use data and analytics to improve performance. The course includes data analysis, statistical methods, and HR metrics. Upon completion, you will have a comprehensive understanding of using data and analytics to improve HR performance. To learn more and register for the course, you can visit www.chrmp.com.
Conclusion
In conclusion, HR analytics tools have emerged as invaluable assets for modern organizations, revolutionizing the way human resources departments operate. These tools provide powerful insights and data-driven solutions to enhance HR decision-making, improve employee engagement, and drive overall organizational success. By harnessing the power of data, HR professionals can make informed decisions, streamline processes, identify talent trends, and proactively address potential challenges.
The blog highlighted some of the top HR analytics tools available today, showcasing their unique features and benefits. From predictive analytics to employee sentiment analysis, these tools offer a wide range of functionalities that cater to various HR needs.
They enable HR teams to measure and optimize key metrics, such as recruitment and retention rates, performance evaluations, diversity and inclusion initiatives, and workforce planning.
The implementation of HR analytics tools has far-reaching impacts, empowering HR professionals to become strategic partners in organizational growth and transformation.
The implementation of HR analytics tools has far-reaching impacts, empowering HR professionals to become strategic partners in organizational growth and transformation.